
Designing Project Management Tool for an Oil and Gas Company
📍 Perth, Australia | ⏱️ 8 weeks

Challenge
I was engaged by Ruffle Design Co to design a project management tool for the client to help them monitor progress, and eventually reduce project delays. Throughout the process, I teamed up with a project journey lead from the client’s side.
Output
Medium-fidelity prototype for the Minimum Viable Product (MVP).
Design Process

#1 Design Workshops (Users Needs)
We started off by doing a series of workshops with the stakeholders to better understand the target users and the problems we’re solving.
Output
Improved domain knowledge (user needs): better understanding of the users and processes within the organisation, including relevant constraints.
Improved domain knowledge (business) - Project Vision: better understanding of client’s expectations from the project, and how the new system might help them improve their business process.
Prioritised target users and problems
#2 Design Workshops (Diverging)
Together with the clients, we explored a wide range of possible solutions with minimum constraints in mind to come up with the most ideal solutions for users, before minimising them for the MVP.
Output
The user journey of the most ideal solution for the target users that is going to be utilised in the converging design workshop.
#3 Design Workshops (Converging)
We narrowed down the solutions into the MVP based on limitations and constraints (time, cost and technology)
Output
The main user journey for the MVP.

#4 Design Workshops (Paper Prototypes)
We added details for the user journey and pages before jumping onto Figma.

Output
Detailed user journey and pages.

#5 Design on Figma
After we all agreed on the user journey and pages, I translated the sketches onto Figma.
Output
Interactive prototypes for development and usablity testing.


#6 Usability Testing & Refinement
We did usability tests on 5 users with the Clients observing all sessions.

After the sessions, we debriefed the findings together with the clients and prioritised the improvements.
Output
Refined designs and prototypes.


Early exploration on the dashboard. Based on the first three usability tests, it took some time for participants to make sense of the three panels at the top. We decided to tweak the design so that we can test the refined prototype with the last two participants.
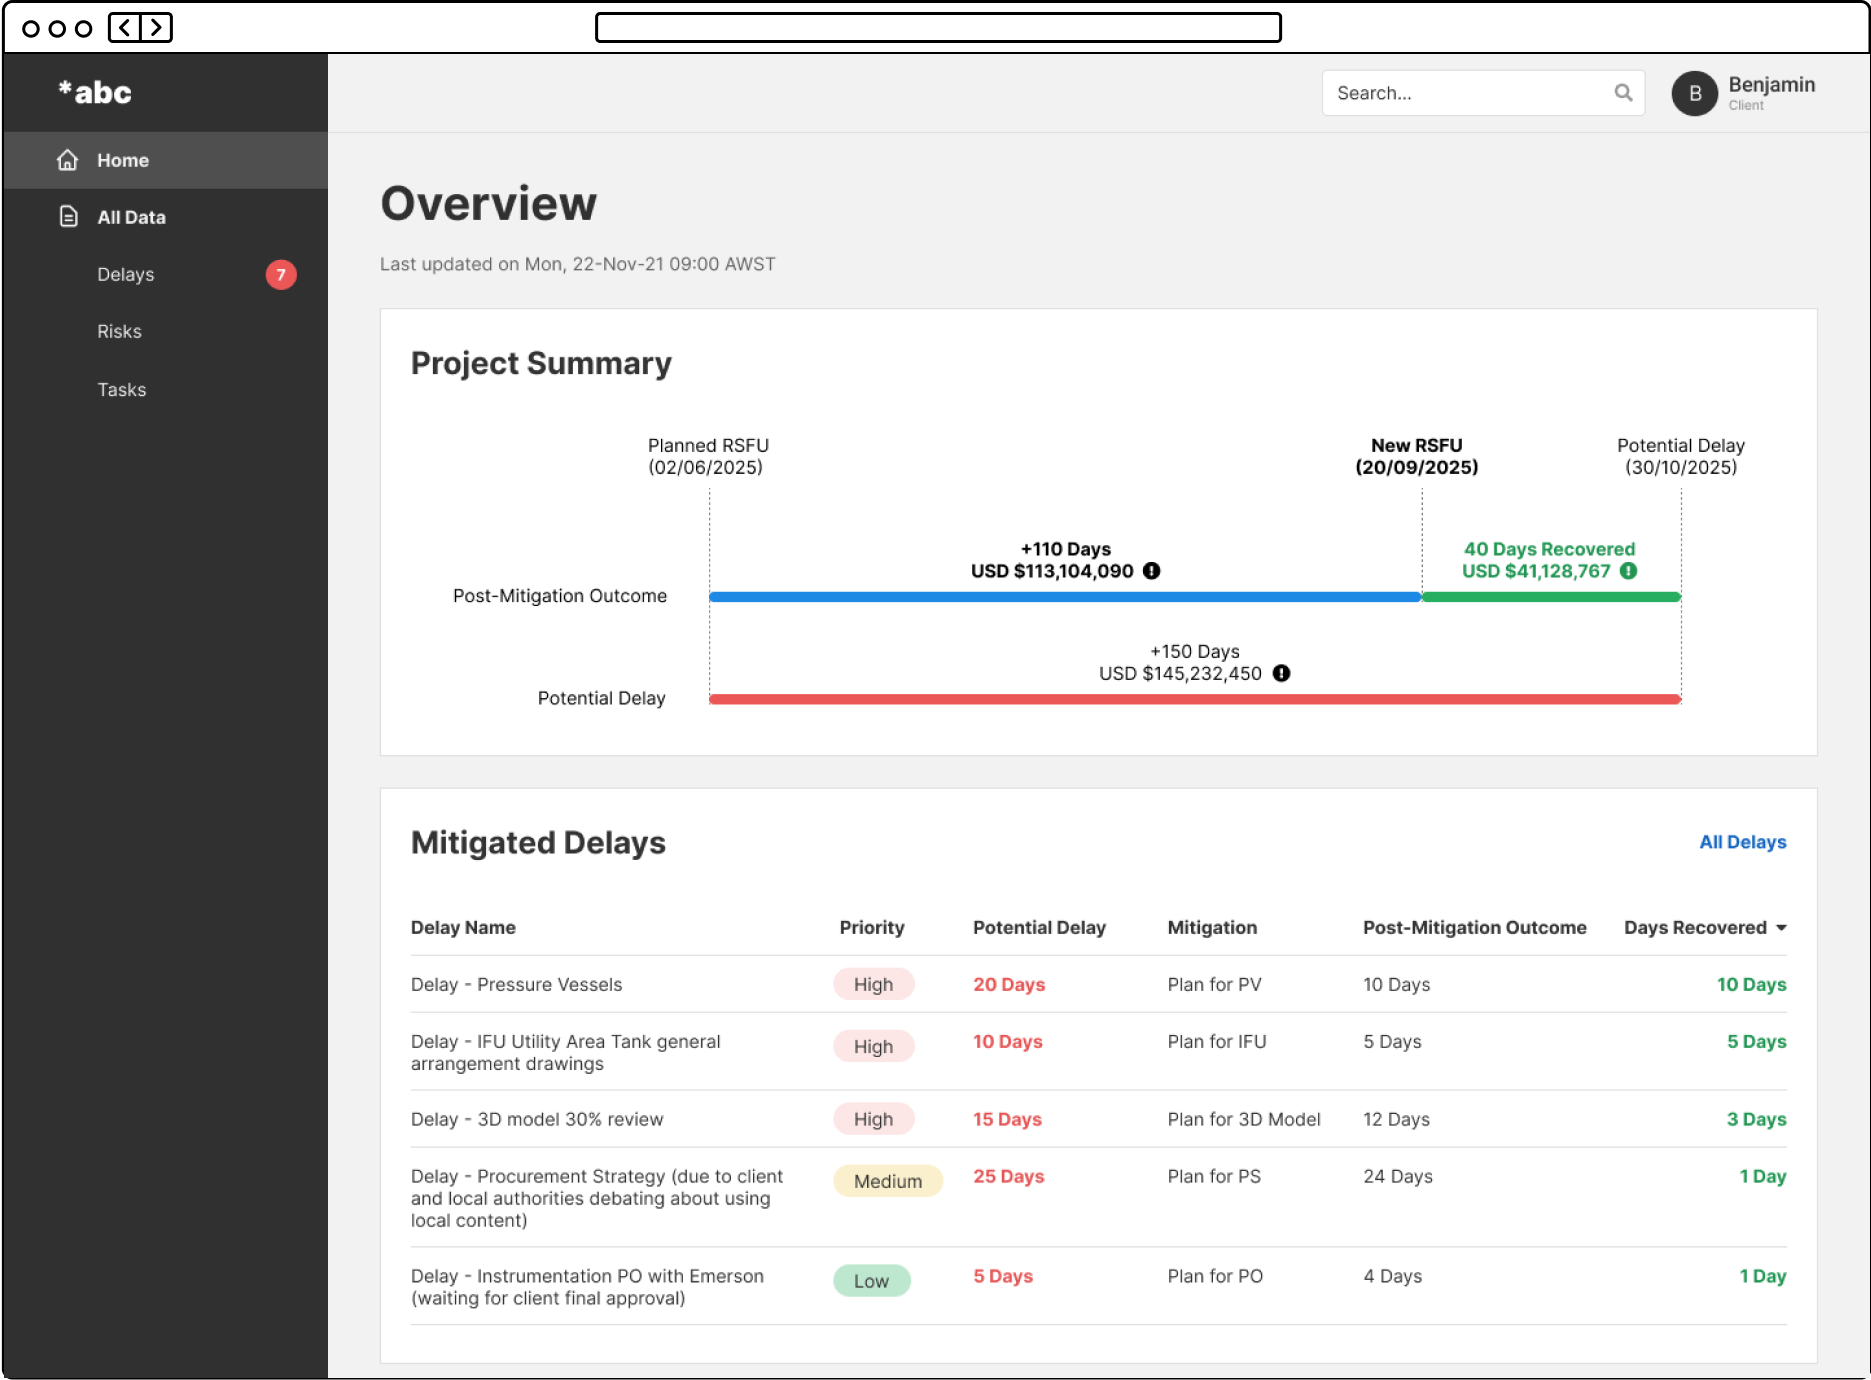
Final client dashboard with a graph to help users understand the data quickly. The last two participants understood the data straight away during the usability test.
Impact
The design has helped the client frame and build the Minimum Viable Product (MVP). Additionally, product backlogs are also provided as the outcome of the diverging workshops for the next phase of the product.